
Much has been said or written over the past decade about the future direction of interest rates. Nearly everyone has an opinion on the subject including professional investment managers, CNBC correspondents, your golfing partner, and the person who cuts your hair.
We like to make investment and financial planning decisions based on what is known rather than what anyone (including your golfing partner, hairdresser, or us) thinks will happen. With that said, let’s consider a few things that are known about the bond market:
1) High quality bonds provide a useful hedge to equities, having historically offset sharp equity sell-offs with gains over the same time period.
2) Interest rates could go up or down from current levels, depending on the health of economic growth.
3) Treasury yields rose from 2.3% to 14.0% between 1954 and 1982. During that stretch of rising interest rates, rolling 3-year returns at the end of each calendar year were positive in 23 of the 25 periods.
4) High quality, 10-year bonds can be expected to return 2.5% over the next decade.
The first two items likely generate little novel insight. The 3rd item may have surprised you, considering that rising interest rates are typically associated with weak bond returns. If it did not surprise you, read again. The 4th point may have left you looking for more answers from our crystal ball.
Unfortunately, our crystal ball does not provide an answer to whether California Chrome will complete the Triple Crown or how intermediate duration bonds will perform over the next week, month, or even year. Yet simple bond mathematics provides us the ability to predict, with a high degree of confidence, the expected return of an intermediate-term bond over the next decade.
By definition, the return of a zero-coupon 10-year Treasury bought and held to maturity equals its yield to maturity at the time of purchase. Short of default, that is a mathematical truism. In the real world, this math is empirically documented as depicted below. The only variable for a coupon paying bond held to maturity is the yield at which coupon payments are reinvested. Resultantly, the 2.5% current yield of 10-year Treasuries provides a strong estimate of future bond returns. If interest rates rise from here, the realized return will be higher than the original yield because coupons get reinvested at higher rates. Conversely, falling yields will result in a holding period return below 2.5%.
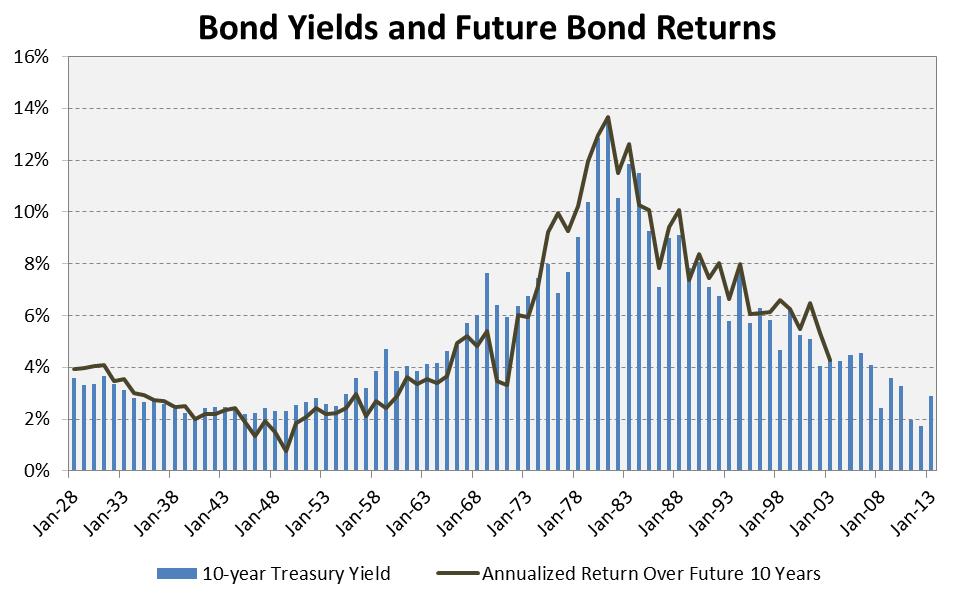
The chart above demonstrates with 86 years of evidence how well the 10-year Treasury yield at any point in time predicts the future return over the next ten years. The blue bars represent the beginning-of-year Treasury yields and the dark line depicts bond returns over the next 10-years. It should be clear that there is a strong linkage between these two factors. Over this time period, the 10-year Treasury yield explains 91% of the return an investor would realize over the subsequent decade when holding a bond to maturity and reinvesting coupons at the prevailing rate.
Armed with the foresight of bond returns over the next decade, you should consider some of the practical implications:
1) Don’t look for your bond portfolio to earn high or even mid-single digit returns over the next decade. Whereas stocks have no limits on the upside returns, bond returns are mathematically constrained by the purchase yield. In order to generate a 5% nominal return over the next decade on a recently purchased 10-year Treasury, you would need interest rates to immediately rise to 18.8% and stay at that level for the subsequent 10 years. While you might get your 5% nominal return in that environment, a sustained 18.8% interest rate over the next decade would be otherwise ugly. Alternatively, you or your golfing partner could try to manufacture a 5% return by timing in and out of the market. Just be forewarned that this is generally a painful losing proposition.
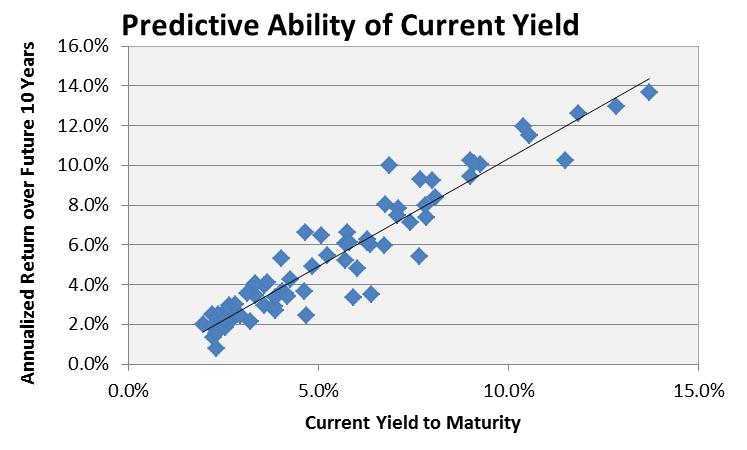
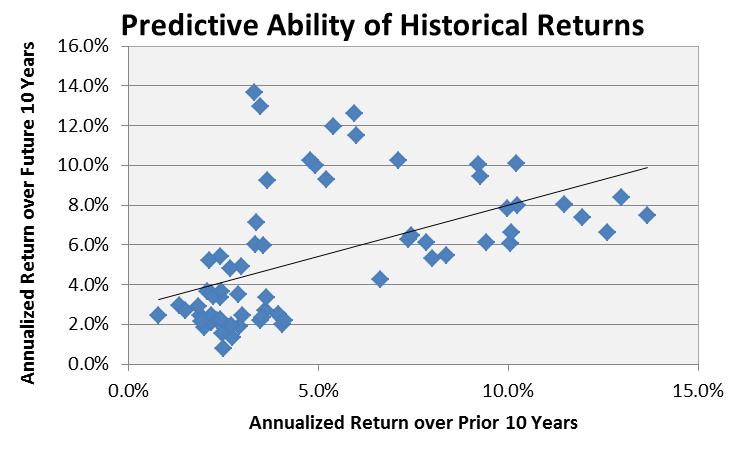
2) When planning for the future, you would be wise to lean on the predictive ability of current yields rather than historical returns. Consider the two scatter charts below. Each plot represents a calendar year-end dating back to 1928. The chart on top compares the yield to maturity at any point in time to the future 10-year return. The lower chart compares the prior 10-year return to the return over the next 10 years. As mentioned before, current yield to maturity predicts 91% of the next 10-year return. The historical 10-year return predicts 27% of the next 10-year return. If your financial advisor is simply using historical returns to project the future in a financial plan or an insurance salesman is using historical returns to illustrate an insurance product, you would be wise to ask why. Simply relying on historical returns to make important planning decisions about the future could be a costly mistake. We know that no forward-looking assumptions will be perfect but important decisions merit the application of logical and well-reasoned assumptions.
3) Finally, don’t take this knowledge of future return expectations to suggest selling bonds in favor of stocks or real estate is a good idea. All investments in stocks, real estate, or any other asset are valued using an implied discount rate. When interest rates are low, the discount rate is inherently low, and the future expected return of all investments is low. Low bond yields do not exist in a vacuum. The math on projecting future 10-year stock returns requires several more steps but is similarly depressed by low interest rates.
The reality is that you can’t squeeze lemonade from a turnip. Similarly, it is nearly impossible to create a scenario over the next 10-years where bonds achieve holding period returns in excess of 5%. In fact, if you’re asked to wager on bond returns over the next decade, 2.5% would be a difficult bet to beat.
Have thoughts, comments, or suggestions? Please do not hesitate to comment below.


Leave A Comment