“Describe your perfect day.”
Such a simple interview directive rarely fails to provide the most telling of replies. Responses are almost never scripted in advance and usually provide productive insight into what motivates the interviewee, what passions she has, her creativity, or how she organizes her day. Responses from previous experience posing this question (even though it’s not truly a question) include everything from the ambitious hour-by-hour mapping of an elaborate overseas day trip to the far more conservative and less riveting derivations.
At this point, you may have just contemplated your own perfect day and already begun scripting the answer in your head. Now imagine yourself as the stock market and consider a slightly altered directive:
“Describe your perfect year.”
You’re the all-powerful stock market. What would this perfect year look like? Clearly, it would be a year of strong performance. It would, additionally, not be a head-scratching year of market gains that contrasted with corporate profit weakness nor would it be an irrationally exuberant year where investors just seemed giddy from a spiked punch bowl and headed for a painful hangover. Moreover, the perfect year would be a year devoid of peaks and valleys – instead one with just consistent advances. There would be no panics and minimal discomfort. The year would culminate with encouraging economic prospects and maybe even favorable legislation for stocks. Or drawing from the guidance of Occam, the answer to this hypothetical directive might simply be “2017.”
A graph of every major stock market in 2017 – US stocks, European stocks, emerging market stocks, etc. – looks like the path of a train going from San Diego to the northern border of Maine with hardly any diversions in between. Regardless of what happened in the world, including historic natural disasters, ISIS-linked terror attacks, North Korean threats, or political mayhem, the stock market seemed impervious and impenetrable. It was a train that just plugged along. 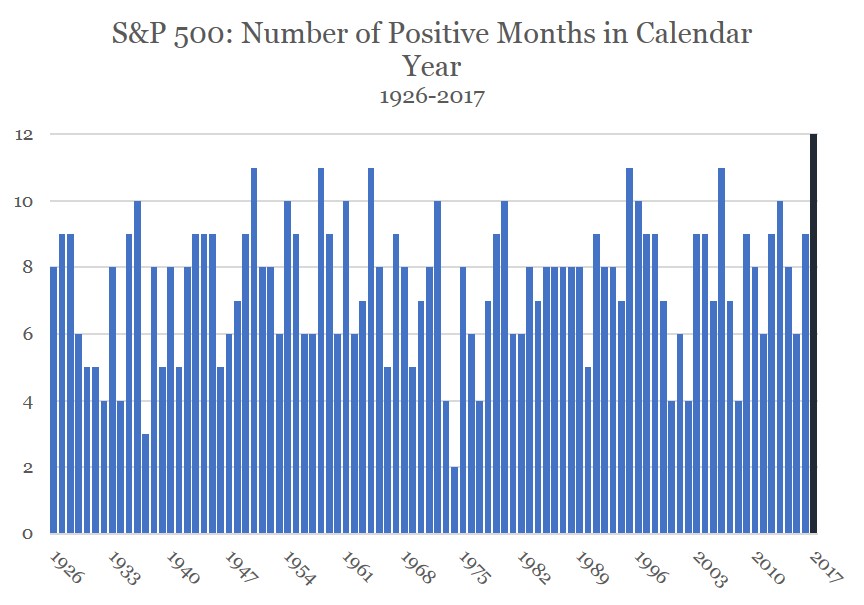
For the first time since its inception in 1926, the S&P 500 Index posted gains in every calendar month. 12 for 12. In fact, the streak of positive months now sits at 14 and would be at 22 if not for a -1.8% month in October 2016. Remember how catastrophic that 1.8% loss in October 2016 felt? Yeah, not really. It’s been a smooth train ride from southwest to northeast that is still chugging along.
So now that we’re in the spirit of posing as the stock market to answer interview questions, let’s tackle a few more.
What does your performance in 2017 tell us about what to expect from you in 2018?
Nothing at all. Next question.
Maybe you can provide a little more detail. You improved by 22% in 2017. Should we expect you to deliver similar results in 2018 or does that strong performance last year bode poorly for 2018?
First, I politely request that you not merely evaluate my work here in the US. My global results were notably better than the 21.8% I provided here in the US.
Valid. I won’t make the mistake again.
Thanks. Second, you should not fear that my strong job performance last year bodes poorly or positively for the next 12 months. More than 90 years of empirical evidence has demonstrated no meaningful serial correlation in my value from one year to the next.
Sorry, I’m unfamiliar with the concept of serial correlation.
What I’m trying to say is that my past results provide no useful predictive guidance of my future results. Think of it like flipping coins. The fact that the last 10 coin tosses have come up heads does not mean that the next coin flip is any more likely to be tails than heads. You humans love to look for predictive trends but empirical evidence suggests there are none in flipping coins and none in forecasting my next year’s performance.
I brought some charts to offer some historical evidence that may help prove my point. Both of these charts display my historical performance – one here in the US and one outside the US. The darker blue bar on the right of each chart shows my historical likelihood to deliver positive results in the year after performance of 20% or more. As you can see, I’m no more or less valuable heading into 2018. 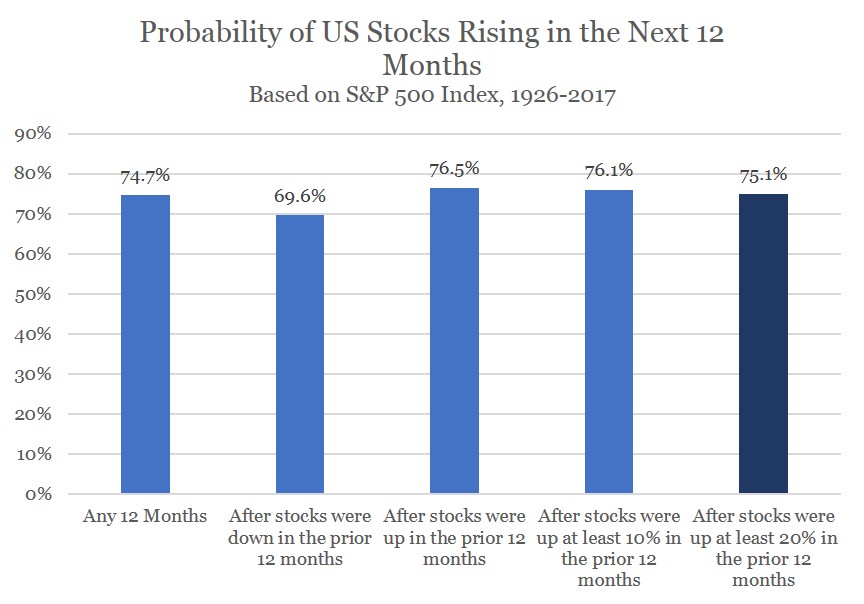
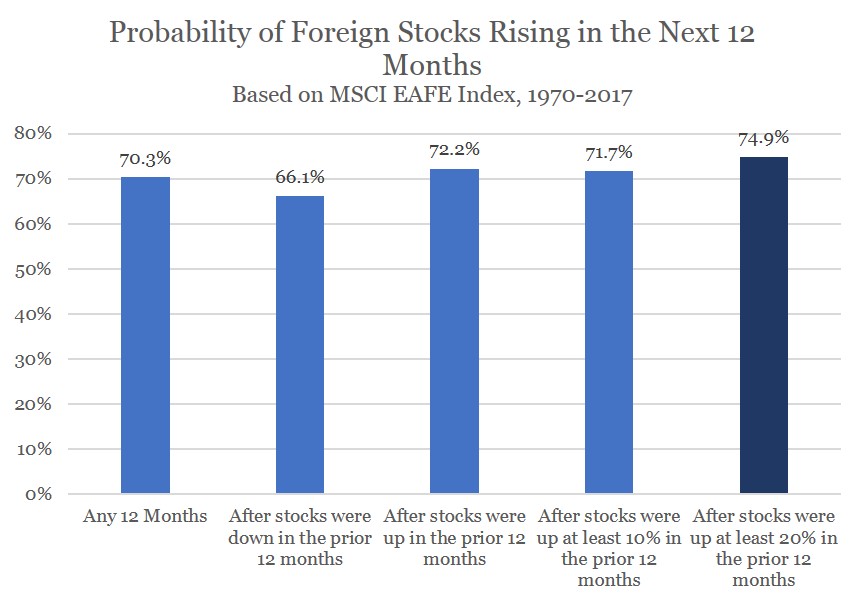 These charts actually seem to suggest that you’re more likely to deliver positive results immediately following a year in which you gained at least 20%, like 2017, than in just a year pulled at random.
Don’t read too much into these charts. The important take-away is that just because I posted big gains last year doesn’t mean I’m likely to perform poorly this year.
Fair enough. Last year you were a fairly consistent performer in your job. Should we expect you to be as consistent this coming year?
Before you label me as a “fairly consistent performer,” I’d like to provide a little historical perspective. Between 2007 and 2012, there were 201 days when my domestic performance was at least 2% better or 2% worse than the day before. And remember, I don’t work weekends or holidays so that’s basically one in six days during that stretch when I was invited to your office – either to be praised or admonished.
Yes, I remember that all too well.
I have not been back to your office since September 2016. That streak without a 2% up or down day will hit 300 days later this week (January 18th).
If you want to measure the consistency of my performance in a more academic way, consider the volatility of my daily performance. I have not had a one year period with volatility as low as the past 12 months since before you humans stepped foot on the moon. Which is to say that it’s been a really long time since I was this consistent. 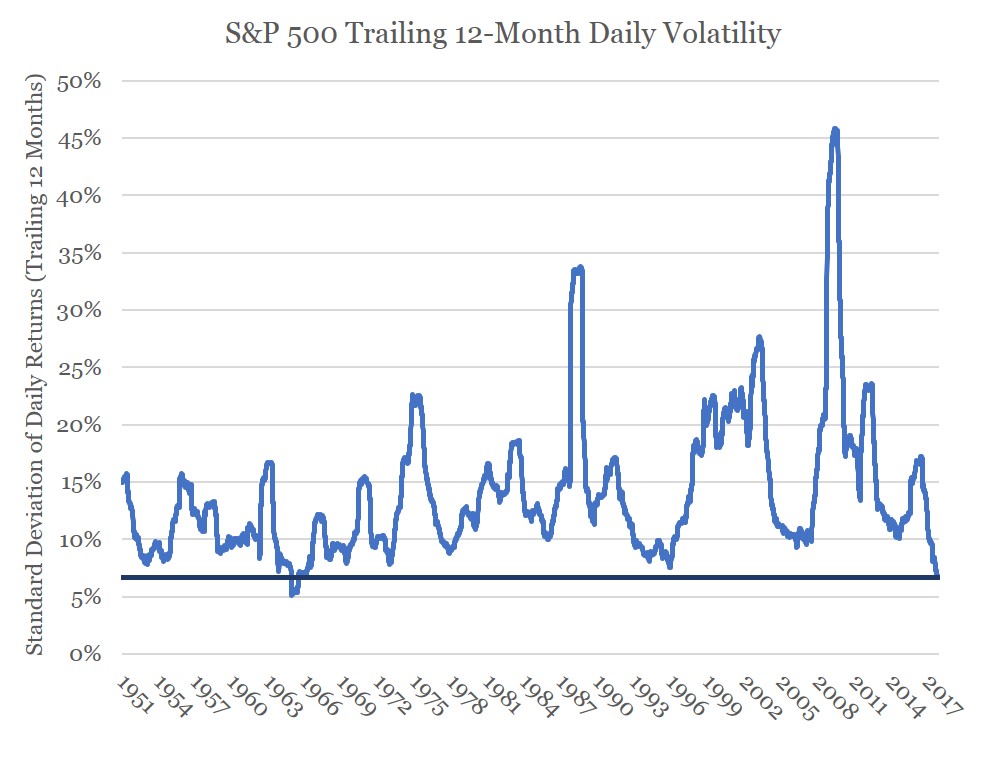 And before you mention it, I know I asked that we consider my global results but there’s just a lot more historic data for my domestic results which is why I use it here.
Is this your way of asking for a raise?
No, I’m just highlighting how historically unusual my consistency has been and suggesting that you should not necessarily expect me to continue like this forever.
So you’re asking me to give you some latitude in the future. Is there any way to know when you’ll revert to your volatile ways?
Probably not. But when my doctors stop prescribing my medication, that may be your best signal.
What doctors?
I have a whole team of doctors. You might know Dr. Yellen here in the US, Dr. Draghi in Europe, or Dr. Karuda in Japan.
Sure, the chairs of the major central banks. But they’re prescribing you medication?
They’ve been not only prescribing but also feeding me these medications for some time now – in the form of easy monetary policy. And the drugs have worked to mollify my volatility. Of course, this is not to say that when I stop getting the medication, you’ll see ramped up volatility out of me. But it is likely that I will be more volatile than what you have seen out of me of late.
So when you stop taking drugs, that’s when I should get concerned about your performance?
Not necessarily. First, I did not say you should be concerned about my performance. I suggested that my performance might just be more volatile. Moreover, the drugs aren’t perfect. Unanticipated disorder in geopolitics, inflation, national security, or even something more mundane could disrupt my performance without a change in medication.
The point is that you should not become complacent or gain a false sense of security by my lack of recent volatility. If you rely too much on just me or you are not prepared when my volatility returns, you will likely regret ignoring my warnings during these performance reviews.
OK, let’s move on and wrap this up. You’re an expensive employee. By several measures, we have not paid you this much since the late 1990’s. We know how that turned out. Make the case that we should continue paying you as much as we do.
Fair question but do you remember when we talked about considering my work outside the United States? I also encourage you to consider my value outside the US. I may be expensive stateside by several measures but what you pay me for my overseas work is much more reasonable and, in some cases, you’re getting a deal. So just keep that in mind.
Additionally, we’ve gone over this issue before in past reviews. How much you pay for me is a lousy indicator of my short-term performance – like how I’ll perform over the next year. Historically, I have often delivered stellar one-year results even when you factor in how expensive I was at the start of the year. This is to say that you should not give up on me in the short-term just because I may be expensive. 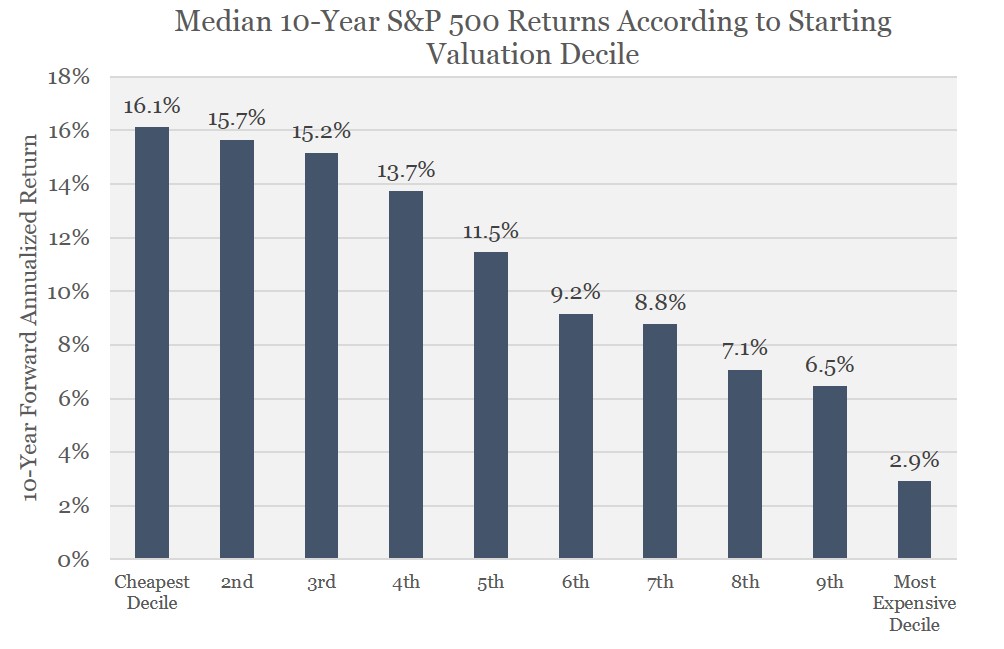
Of course, it is only prudent for me to remind you that my expensiveness is a reasonable predictor of my long-term results. If you pay an above-average level for each unit of earnings I produce, it does not mean that my results will be poor or that you’ll get less from me than some of my counterparts. It just suggests that you should expect less profitability from me over the next decade or so than you’ve had from me in the past.
Your candor is always appreciated. And thanks for your good effort this past year. Now back to work.


Leave A Comment