
A respected portfolio manager presented recently at an investment symposium where she explained an investment strategy that has consistently maintained zero correlation to stocks. Several times during her presentation, she described why the strategy should be expected to maintain a near-zero correlation to stock markets in the future.
During the break that followed, financial advisors from the audience privately scoffed at the speaker’s repeated references to correlation and implied importance of zero-correlation. “Why such a big fuss about correlation?” asked one financial advisor to the nodding agreement of other advisors. “I certainly don’t care about correlation,” said another advisor in the small group that had gathered, “and I guarantee that my clients don’t care about correlations.”
It would have been an awkward time to explain to these financial advisors, all of whom were entrusted by their clients to intelligently invest many millions of dollars, why they should emphatically care about correlations. Or to explain why their clients – unless they were invested entirely in a single stock – should care about correlations.
The fact is that their clients should care a lot about correlations. The clients just don’t know how to describe it this way and their advisors have failed to explain why the correlation of investments matters to investment results.
Modern portfolio theory, the core foundation of institutional investment management over the past 50 years, is underpinned by the mathematical concept of correlation. In his 1952 paper that later resulted in a Nobel Prize in Economics, Harry Markowitz described how, by combining uncorrelated investments, investors could maximize the expected return for a fixed level of risk. The underappreciated result is that the expected return of an individual investment is less important than how the investment behaves in the context of the portfolio. Read that last sentence again. The free lunch that diversification provides means that you can actually put two uncorrelated investments together, each with a 5% return, and get a better end result for the same level of risk than two correlated investments, each with an 8% return. This is why, and how, correlation matters.
You Own the Best Collection of Talent Ever Assembled
It may help to use a baseball analogy, even if that means reusing the subject of a prior investment letter. Consider that you own a baseball team comprised of the best hitters that the game has ever known – all stacked on one roster. All nine players have batting averages of .470, which anyone with the slightest knowledge of baseball will appreciate as outlandishly spectacular. To help put this in perspective, the aggregate batting average of all major league baseball players in 2017 was .255. The greatness of your team has no precedent in sports history.
Now for the curveball (it is a baseball analogy, after all) – your players either have great days or lousy days on the same days. To give this some context, imagine that on half of the nights before a game, your entire team stays out partying until 4 AM (preceding the lousy hitting days). On the other half of nights, they’re all in bed by 10 PM (preceding the great hitting days). You are not able to predict or know which nights they will go out partying such that in 50% of the games, all your players struggle to hit the ball and in the other 50% of games, they are all spectacular¹.
Your team plays a normal 162 game season against a league of good, but not great teams. The opposing players have a combined .285 batting average against you meaning that, on average, they get hits 28.5% of the time. The big difference is that their individual performance is not correlated. Some days, one opposing player may go 0 for 5 while another goes 4 for 5.
With the magic of Microsoft Excel, we simulated every at bat of this hypothetical season. When all was said and done, your team scored a whopping 1,105 runs (6.82 per game) including a 39 run outing in August and a 37 run performance in May. They set the single-season record for hits (1,783 by the 1930 Philadelphia Phillies) before their 100th game. Yet with such offensive dominance, your team won 80 games and lost 82. You won 80 of the 81 games when your players were spectacular, only losing a 7-3 ballgame in the 97th game of the season when your squad left 16 runners on base. But you lost all 81 games when your players were lousy.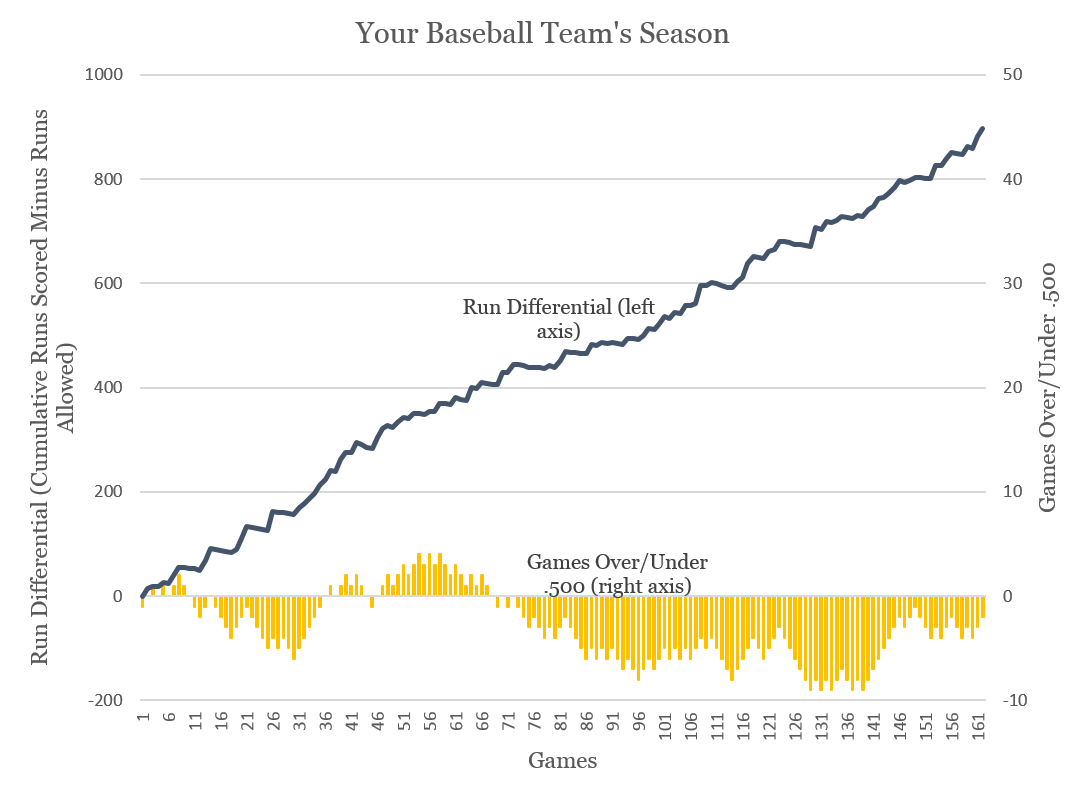
This simulation may seem far-fetched. And it intentionally is far-fetched to show how important correlation can be. The intent is to demonstrate that even with the greatest team of players ever assembled, you still need the individual performances to be uncorrelated or what you end up with is a team that does not even make the playoffs. To say it differently, you would far prefer your players to randomly and individually party until 4 AM before a game rather than all go out partying on the same nights.
How Big a Deal Correlation Can Be For Investors
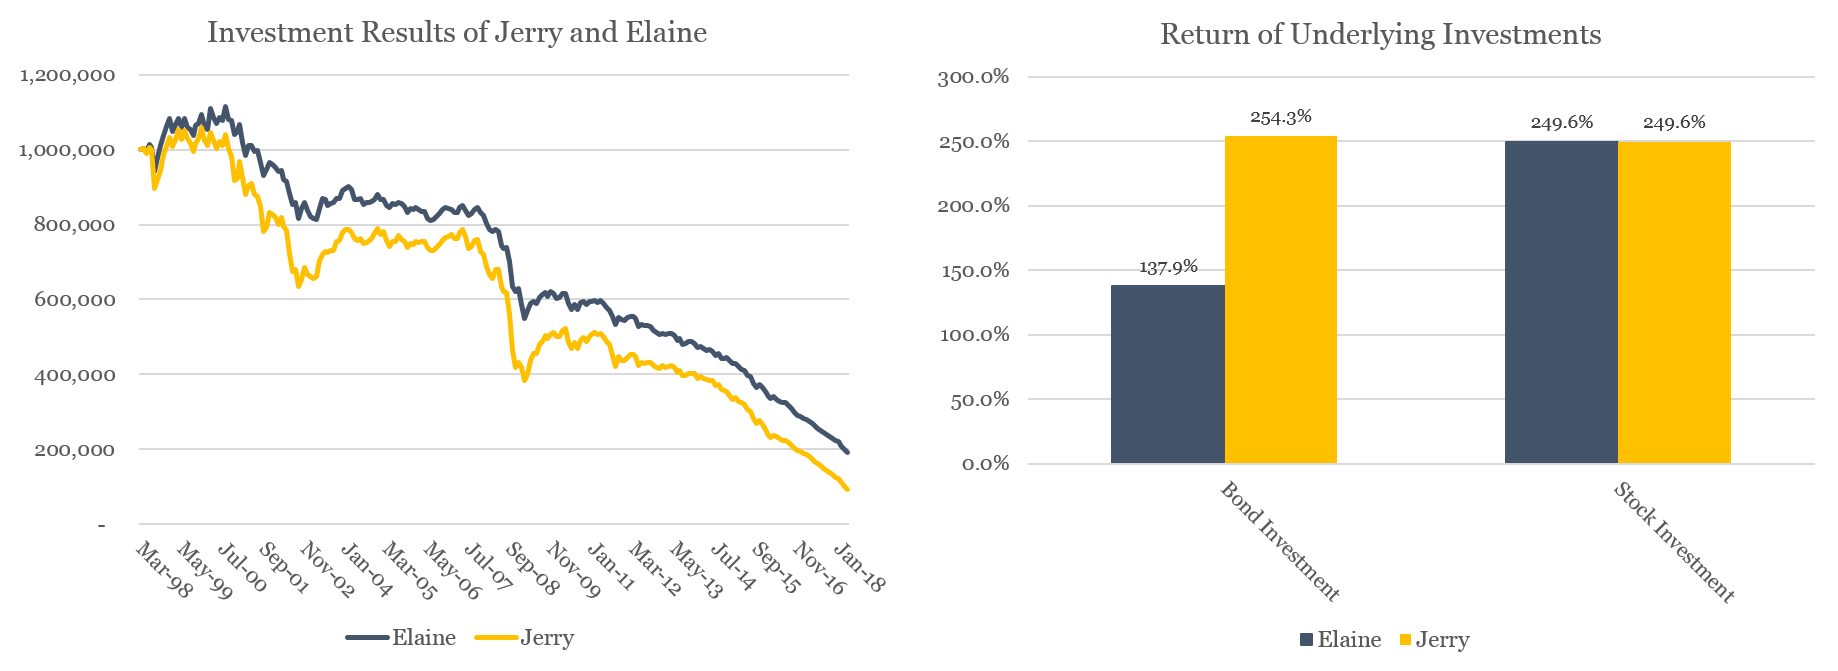
Now let’s use an investment example with real-life figures. Assume that 20 years ago, in the spring of 1998, an individual named Jerry decides to invest half his investments in stocks and the other half in bonds. For the stock portion, he buys the S&P 500 Index. For the bond portion, he buys a high yield bond index (an investment that tracks the Barclays High Yield Corporate Bond Index). Jerry starts with $1,000,000 and needs to withdraw $5,000 each month, increased by inflation².
At the end of last month (March 31, 2018), after 20 years of growth and distributions, Jerry has $93,885 remaining. The S&P 500 investment finished the 20 years with a 249.6% return (6.5% annualized) and the high yield bond with an even better 254.3% return.
Now consider Jerry’s friend, Elaine. She did everything exactly the same as Jerry except that her bond investment was in an investment tracking the Barclays Government Bond Index rather than the High Yield Index Jerry used. She took identical distributions each month and had the same 50% mix of stocks and 50% bonds. Unfortunately, Elaine’s bond investment only returned 137.9% (4.4% annualized) compared to the 254% of Jerry’s bond investment.
Despite having the same stock investment as Jerry and a bond investment that severely lagged Jerry’s bond fund, Elaine ended the 20-year period last month with $191,576 – nearly $100,000 more than Jerry. Elaine’s investments performed notably worse but she ended with a higher portfolio return. The explanation? Correlation.
Jerry’s high yield bond investment was far more linked (i.e. correlated) to the stock market so that in months when stocks performed poorly, the economically-sensitive high yield fund tended to perform poorly at the same time. Conversely, Elaine’s government bond fund tended to have positive performance in months when stocks fell as investors scrambled to the safety of US government bonds. In mathematical terms, Elaine’s government bond fund had a negative -0.31 correlation to stocks over the 20 year period whereas Jerry’ high yield bond fund had a positive 0.62 correlation to stocks.
Defining the Right Goals and Managing Toward Them
Investors may not realize that they care about correlations but that is likely the result of misdefined goals. If the goal is simply to have the best performing investment or investments, then Jerry wins and he does not need to care about correlations. If the goal of your hypothetical baseball team is for the players to all have great batting averages and you don’t care at all about winning games or making the playoffs, then you don’t need to care about correlations.
Arguably, the real goal of a rational investor is not at the investment level and always at the portfolio level. These goals will vary but generally involve things like having a portfolio that supports spending needs, not running out of money in retirement, or accumulating wealth to give away. None of those goals are about the performance of an individual investment. They are all about the performance of a portfolio. And if that’s the case – then correlations matter…a lot.
Of course, you want any investment you own to have a positive return over time. However, you also want your investments to have low or negative correlations to one another. Most investors grasp the first concept and fail to appreciate the second.
The underappreciated reality is that we spend an awful lot of time evaluating, modeling, and thinking about the correlation of any one investment to the other investments in a portfolio. The expected return or the actual return of an investment is a component of the evaluation but it’s not the only component. Often times, the return is not even the most important component for a single investment as demonstrated in the example of Elaine and Jerry.
What this means is that there should always be an investment or multiple investments in your portfolio that you wish you didn’t own each day, each month, or each year. There should always be at least one investment that you wish was sold a year ago.
To borrow from the baseball analogy, we realize that each investment in your portfolio will occasionally go out partying until 4 AM. Our goal is to simply minimize the likelihood that all your investments go out partying together until 4 AM on the same nights.
¹The baseball simulation model assumes that in 50% of games during the season, the batters on your team are all great and in 50%, they are lousy. In half the games when they are great, there is a 55% chance that each batter will get a hit (.550 average). In the lousy half of games, there is a 10% chance that each batter will get a hit (.100 average). Because the players come to bat far more times on the great days – since outs are less frequent and each inning has more at-bats – this translates to a .470 batting average over the season in the typical 9 inning game. For simplicity, we assumed that all hits were singles and that all outs were strike-outs (i.e. no double plays). The simulation model also assumes that runners advance one base on a hit. We also didn’t specify home or away games so the home team bats in the bottom of the 9th inning, even if winning the game. This last point doesn’t impact the win/loss result – just the score.
²This backtest assumes the portfolio is rebalanced monthly with no tax or trading costs. Spending is increased by the monthly CPI figure.


Leave A Comment