I’m learning to fly, but I ain’t got wings
I recently spoke with a pilot about how he obtains and handles the forecasts for in-flight turbulence in advance of a flight. Before each flight, he gets a fairly precise report of weather along the route and something called a turbulence plot, which is based on reports from flights that have recently traversed the same route – often within the hour. As a result, pilots like him are well informed about the likelihood of turbulence so they can prepare flight crews and passengers accordingly. This is obviously not to say that they have 100% certainty about in-flight disturbances – just that they have high confidence. Pilots can intelligently choose to change course, fly at a different altitude, cancel beverage services, or simply warn the passengers of likely turbulence.
It goes without saying that investors would appreciate the same kind of preparation or warning. “If there seems to be a modest likelihood of economic recession,” an investor might say “let’s not just sit there but do something.” Yet the reality is that there are two huge and very important differences between applying the pilot’s planning to an investment approach.
When the time gets right, I’m gonna pick you up, and take you far away from trouble
First, consider the same dynamics for an investment advisor. We know from overwhelming evidence that investment professionals and economists are terrible at predicting the future. Renowned behavioral psychologist Phillip Tetlock conducted what is probably the most expansive study of expert predictions ever and concluded that “even the most astute observers will fail to outperform random prediction generators – the functional equivalent of dart-throwing chimps.” Furthermore, the more confident a forecaster is about the future, the greater depth of the expert’s knowledge (beyond a certain point), or the more famous the expert is, the worse the predictions about the future tend to be.
Investment professionals – us included – do not have the luxury of knowing whether our flight path is likely to be bumpy because four other flights travelled the same path in the past hour. We can make what we deem to be educated guesses about the investment flight path but they’re often going to be dramatically wrong.
The second key difference is that there is little downside of a pilot being wrong about projected turbulence on a flight. What happens if a pilot warns passengers to expect some bumpiness and the flight is smooth? Very little. Perhaps the most extreme downside is that the pilot is so concerned about turbulence that he suspends in-flight service, starving each passenger of an 8-ounce soft drink and 20-25 salty peanuts. My pilot friend explained, “Passengers don’t get their drinks but I’ve avoided the remote possibility that we’ll have flight attendants and beverage carts bouncing off the airplane ceiling.” In fact, passengers are seemingly more apt to applaud the pilot afterwards for such a smooth flight.
Alternatively, what happens if an investment manager prepares everyone for turbulence and there is none? The costs are more than peanuts. In this simple example of the “wait until things calm down” portfolio, the costs for the investor are in the millions of dollars.
And you know you better watch your step, or you’re gonna get hurt yourself
But what if a well-informed manager uses a thoughtful compilation of economic data points to predict the probability of a recession and reduces investment risk as the probability of recession elevates? Since we know that humans are terrible at this kind of prediction, what happens if we use an objective, data-driven model?
One of the best coincident recession-forecasting measures, developed in a 1998 paper, dynamically weights important economic indicators such as non-farm payroll employment, industrial production, personal income, and manufacturing data to calculate the real-time probability of recession. The data goes back to 1963 and this tool’s recession-predictive power, evidenced in the adjacent chart, is far better than the track record of expert forecasters. 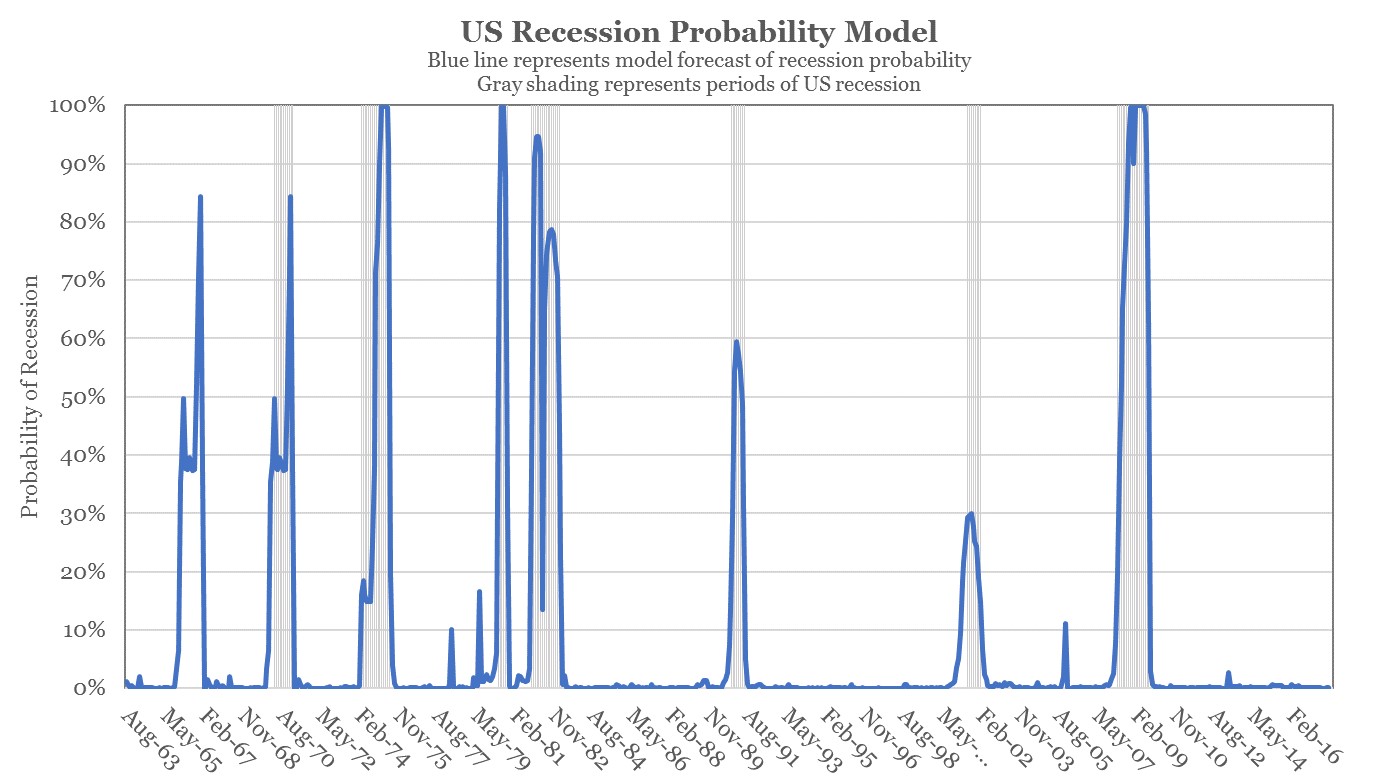
So what happens if an investment advisor utilizes this predictive tool as the pilot equivalent of a turbulence plot? If there are signs of turbulence in the future (i.e. elevated recession risk), the advisor reduces stock market exposure. Otherwise, the advisor stays fully invested. The results of such an investment process are demonstrated below.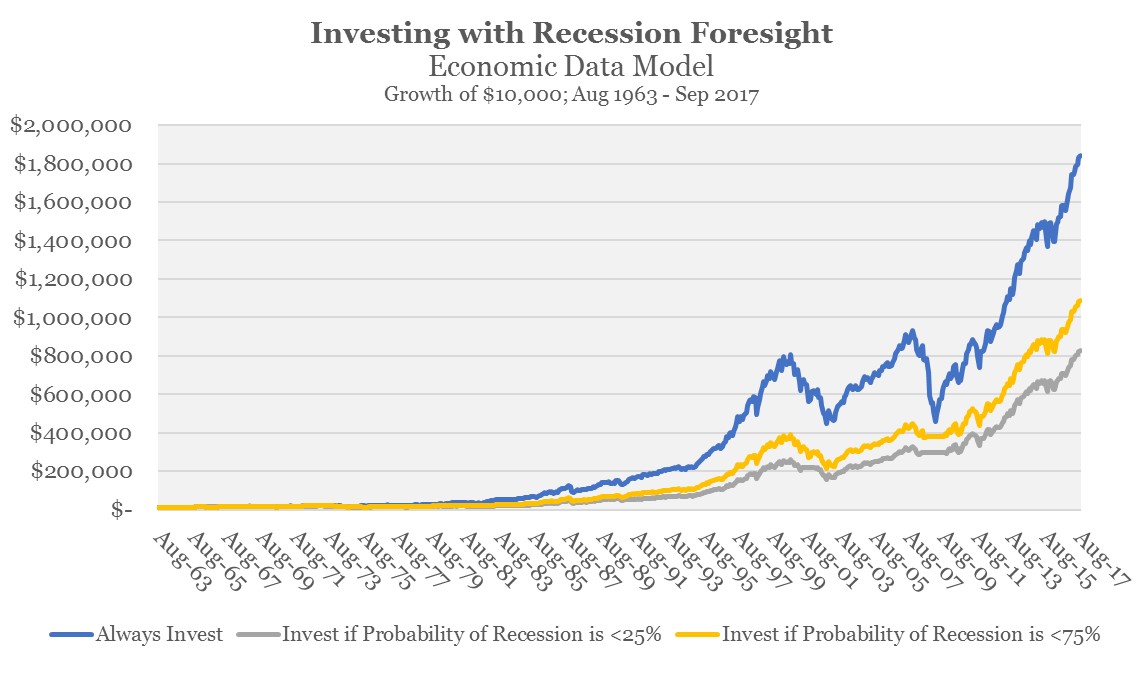
The gray line shows what happens if this advisor were to invest in the S&P 500 Index when the probability of recession was below 25%. That is, if there’s a low probability of recession in the near future, the advisor is fully invested. If the recession probability increased above these levels, the advisor liquidated stocks and waited until the probability dropped back below these thresholds to reinvest. Notably, this investment strategy results in an ending value of $842,517, which is $1,034,732 less than what would have resulted had the advisor just remained fully invested. Importantly, this analysis ignores taxes and transactions costs – both of which would have made the results even worse for the gray line.
The yellow line depicts a version of this methodology where the investment in stocks in maintained at all times unless economic data points are so poor that the probability of recession is nearly assured (75% or higher likelihood). Even though the results are better, the ending value still leaves more than $760,000 on the table relative to what would have been achieved had the advisor stayed fully invested.
What about other recession-predicting models? Another popular tool – and one that also works quite well at forecasting recessions before they happen – is the yield curve model. Instead of using economic data, this model uses predictive market data to forecast recessions a year in advance. While the results are better for the gray and yellow lines, they still fall well short of the buy-and-hold blue line. 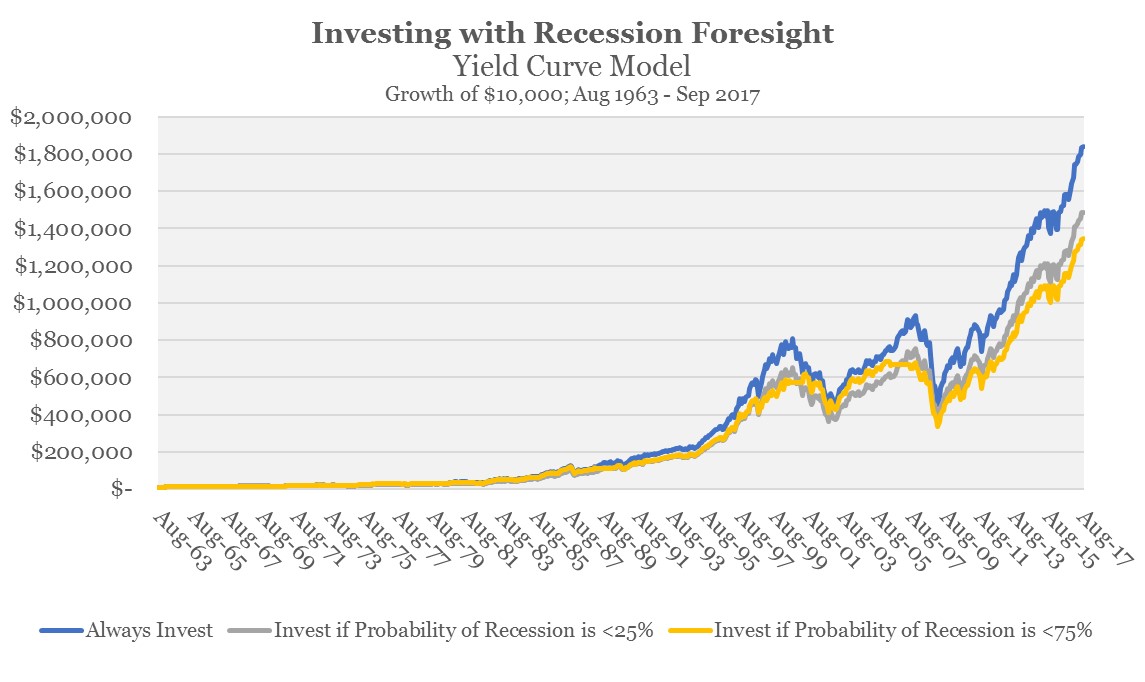
So if models can help forecast recessions, why are these models and the underlying economic data poor tools for market timing? Consider a few explanations, all of which contribute to the historic challenge of market timing:
1) Main Street and Wall Street are two separate places. Said differently, the stock market is not the economy and the economy is not the stock market. In fact, the stock market seeks to be a forward-looking gauge of the economy, not vice-versa.
2) In the short run, stocks move for unpredictable and irrational reasons. To paraphrase noted investor Ben Graham, “In the long run, the stock market is a weighing machine. But in the short-term, it acts like a voting machine.” Significant drawdowns and significant rallies occur when fundamentals would suggest that the opposite should happen.
3) A stock-market timing tool has to get two things right to work well – both the investment exit and the re-entry. If a timing model happens to get one of those two things right but not the other, it likely fails.
4) Valuations, not economic fundamentals, tend to be a far better predictor of returns. These models are simply using economic data points, not valuation measures. Still, while valuations provide more future insight, it’s long-term, not short-term insight.
Trouble blew in on a cold dark wind, it came without no warning
It is clearly possible to sell stocks when there is apparent risk or when important economic and market factors point to future turbulence. Wall Street, which makes money off trading revenue, has a distinct incentive to promote such activity. While it would be nice to reduce investment risk at seemingly opportune times and then get back in when the coast is clear, the empirical reality is that Wall Street, economic models, market experts, economists, and hedge funds tend do a lousy job at this timing.
Does this all mean that such adjustments to portfolio risk are inappropriate? To be clear, this is not the intended conclusion. A few summarized points, each of which could be their own white-paper:
1) There are clearly periods in the business cycle where risk is elevated. Stock values are based on a stream of cash-flows and one should certainly expect a link between stock volatility when streams of cash-flows and profits are at their highest levels of uncertainty (in a contracting economy). Note, however, that elevated risk is not necessarily a negative. Elevated risk tends to get priced into stocks such that if economic reality does not play out as poorly as the weak expectations would anticipate, market returns are likely to be unusually high.
2) There can be a useful purpose to altering portfolio risk but you should expect an economic cost. This is to say that reducing risk during periods of high uncertainty is likely to result in some combination of lower ending dollar values, reducing spending power, and/or a delayed retirement. However, the behavioral benefit of reduced anxiety and/or the increased propensity to maintain an investment plan can justify such a risk-altering strategy in light of the economic costs.
3) The examples above show the economic cost to market timing if you were to sell stocks to 100% cash during periods of heightened uncertainty. Such cost is more than just the peanuts and soda you miss because the pilot cancelled beverage service in light of what was deemed to be a reasonable chance of turbulence. However, the economic costs can be reduced if the alteration is something less extreme than 100% cash and 0% invested.
Lastly, a critical item to remember is that there are always threats and opportunities, reasons to be optimistic and pessimistic. There always are and always will be. We admittedly do not know what the future holds but we will remain diligently committed to making the most of what we do know and what we can control in order to help you achieve long-term success.
With warm regards,
Resource Planning Group


Leave A Comment