Most investors like the idea of waiting for a period of calm to invest. Our brains tell us it is better to wait until there is clarity and risks have subsided before investing. And our brains have good reason to work this way. For our ancestors, waiting until things calmed down was necessary for survival. This impulse helped avoid being crushed by wooly mammoths or mauled by saber-toothed tigers. The behavioral bias to wait for safety results from millions of years of adaptation.
Yet while this bias was useful for the survival of our ancestors, it turns out to be of less use for modern day investing. Actually, it turns out to be quite harmful. Robust empirical evidence suggests that bad investor behavior – selling when things look ugly and buying when they feel good – costs investors somewhere between 4% and 8% per year.
Consider a simple investing strategy where you sell stocks every time there is a 5% loss and wait until things have calmed down before reinvesting. Assume that “calmed down” means that stock prices have recovered back to the level before they were sold. We call this the ‘Wait Until Things Calm Down a Little Strategy’.
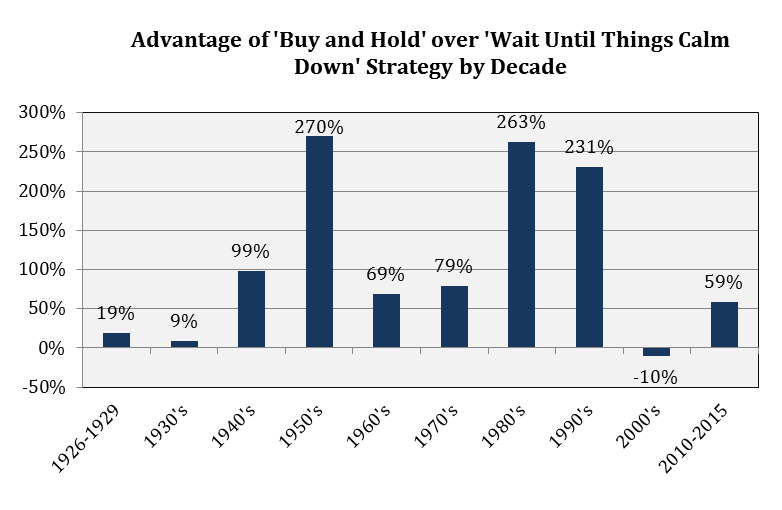
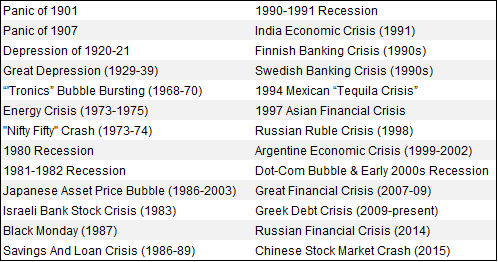
Had you taken this approach starting in 1950 and invested $10,000, you would have more than doubled your money during the past 66 years, finishing with over $24,000. Alternatively, had you invested in stocks on January 1st, 1950 and just done nothing, you would have amassed $1,226,855. Yes, the ride on the buy and hold portfolio would not have prevented all the large drawdowns. It would not have satisfied our behavioral need to do something nor would it have appealed to our overconfident nature that convinces us that we are better than nearly everyone else. What it would have done was make us an additional $1.2 million over the Wait Until Things Calm Down a Little Strategy. We tested variations of the wait until calm approach and the results were similar. We also tested the results by decade going back to 1926 to determine if this advantage of the boring buy and hold strategy was largely attributable to one time period[ii]. It turns out that the strategy of buy and hold won in every decade except the 2000-2009 period when it posted a 0.9% annual loss versus a 0.1% annual gain in the wait until calm strategy. A research-loving friend recently compiled a list of all the major financial crises since 1800. We truncated his summary below to begin in 1900 and include only the major financial crises (a similar list can be found here) The list below ignores “almost-major” financial crises like the Orange County default in 1994, Icelandic financial crisis of 2008, and US debt downgrade in 2011. It ignores all major health panics like those stemming from Ebola, AIDS, SARS, Swine Flu, Polio, etc. It ignores geopolitical crises such as September 11th, the Cuban Missile Crisis, Arab Spring of 2011, Iranian nuclear threats, Middle East turmoil, and Russian invasions. It ignores disruptive nature-related crises like Katrina or Fukushima, political crises, significant tax policy changes, Y2K, sequestration, elections, government shutdowns, Fed rate tightening, and failed budget deals. It ignores both World Wars, both Iraqi wars, and all global conflicts over the past century. If you do some homework and begin to create a comprehensive compilation of all the crises, conflicts, and panics of the past century, you’ll quickly learn that completing the list basically necessitates a full-time research associate. Doing the same compilation for just the past five years will require more than a single sheet of paper. The point is that crises, panics, and risks are a given. Anyone will be hard pressed to find a time period when, at the time, risk and uncertainty did not feel elevated. We kidded that an old colleague would unknowingly initiate nearly every monthly investment committee meeting over an 8-year stretch with the personal sentiment that markets were particularly uncertain or risks seemed unusually high. Each quarter, we update an ‘Economic and Capital Markets Scorecard’ like this recent one. In doing this for over a decade, during both really bad and really strong market environments, there has never been a shortage of reasons for optimism nor a shortage of reasons for caution. Looking back at our library of updates from just the past five years highlights some since-forgotten concerns like an excess housing inventory of >20 million homes, expiring 2010 tax cuts, sequestration, Affordable Care Act passage, an Ebola scare, uncertain election outcomes, Middle East turmoil, high oil prices (remember when?), Detroit default, Cyprus bank closures, Swiss franc revaluation, >10% unemployment, fiscal cliff, and the list goes on. We cannot assure that the next crisis will pass without a major market correction. What we can assure is that there will always be threats that provide coherent excuses to be scared or convenient reasons to be in cash. Now is no different. We can also assure that there will always be well-reasoned authorities who have a good explanation for why doom is imminent and investors should be in cash. Now is no different. As highlighted before, our systematic investment discipline is in place to help us and our clients avoid making behavioral mistakes. That means systematically reducing portfolio risk at times but it also notably means maintaining healthy exposure to stocks in the face of risks. If executed well over a market cycle, the objective is to make our clients the beneficiaries of the long-term transfer of wealth from the impatient (i.e. those who are “waiting for things to calm down a little”) to the patient. [i] These strategies use daily prices of the S&P 500 going back to January 1st, 1950, when daily pricing data becomes available. Dividends are not included in the returns which would make the difference even larger since the “Buy and Hold” approach captures all dividends whereas the “Wait Until Things Calm Down” approach would only be invested to capture some dividends. [ii] Testing by decade uses monthly returns (which go back to 1926) to develop a more robust evaluation. Monthly data also includes dividends.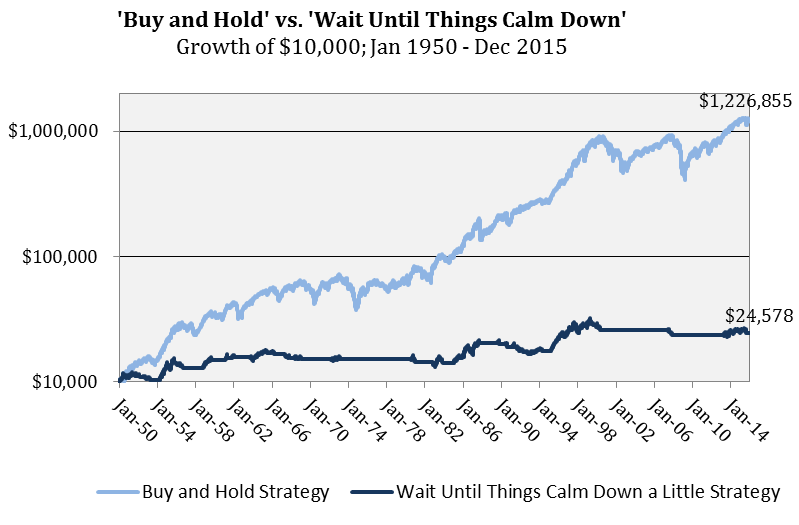
Wait Until Things Calm Down
Investing Scared


Leave A Comment