Brokerage statements are almost universally uninformative, misleading, and confusing. They are largely a means for custodians to fulfill their legal reporting requirements as well as a legacy of yesteryear when we didn’t have access to real-time data. They often neglect important information that would be helpful for investors. In many ways, these statements do far more harm than good because investors confuse them as performance reports rather than the actual accounting reports they are.
They don’t really inform how you’ve done.
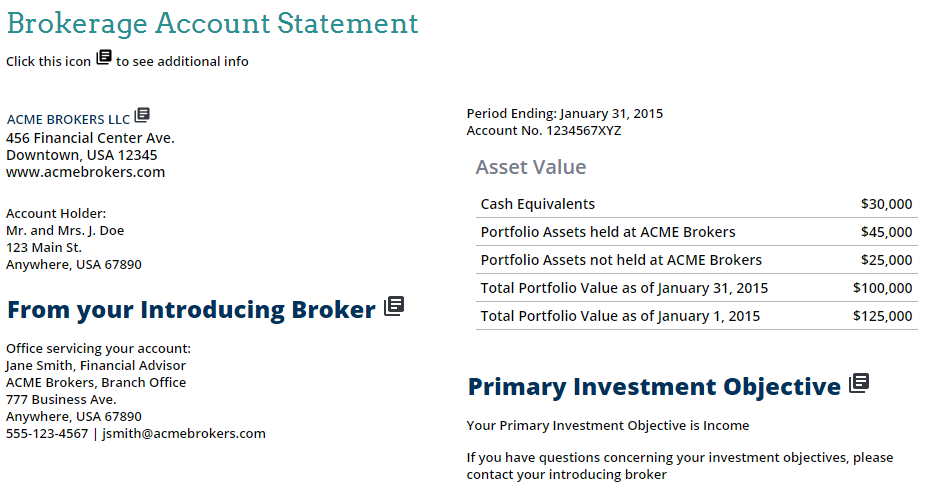
To be fair, you can gather several important data points from most brokerage statements: how much money you started with, how much you contributed or withdrew over the time period, how much money you made or lost, the fees you paid (but often, only a fraction of the actual fees), and the ending value. With that in mind, there are two important drawbacks to most brokerage statements that make them fairly unhelpful for determining how you’ve done.
First, most statements only cover short time periods like the most recent month and the year-to-date period. If you’ve held the account for several years, you are forced to go review old brokerage statements to have an idea of how you did in prior years. This is arguably the single biggest drawback of brokerage statements – that instead of focusing investors on the long-term investing results, they focus solely on the immediate past. Such a focus on the short-term without providing the long-term picture is, frankly, counterproductive to the investment success of nearly all individual investors.
Second, most brokerage statements fail to provide investors with a rate of return as evidenced below.
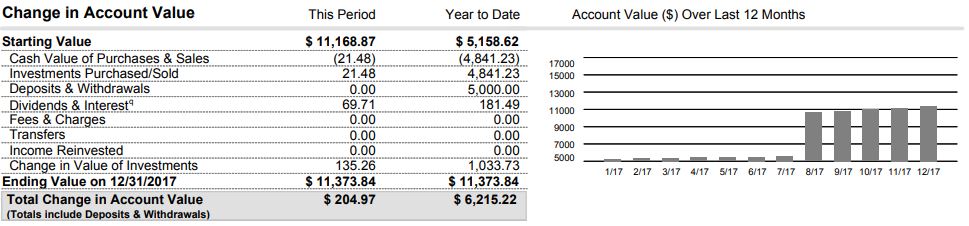
It is often impossible or extremely challenging for investors to use the brokerage statement to calculate a legitimate time-weighted rate of return on their own. Of the brokerage statements that do provide a return calculation, many just divide the change in value by the starting value. Such a calculation works fine if there are no contributions or withdrawals but once you have any deposits, withdrawals, or transfers, the calculation fails. In the example above, such a calculation would generate a 120% year-to-date return.
They are not comprehensive.
Imagine that you click on a link to see how the basketball game went last night and all you discover from the web page is that the home team scored 27 points in the first quarter. You then must click on a separate link to find that they scored 24 in the second quarter. And it then requires two more clicks to uncover how many they scored in the third and fourth quarters. After all of that work, you still have to determine how many points their opponents scored in each quarter and then do the math on your own to add it all up and see who won. Welcome to brokerage statements.
Your brokerage statement summarizes a single account which is not a problem if you only have one account in your entire family. However, most investors have multiple accounts – perhaps a tax-deferred IRA, a Roth IRA, a 401k, a brokerage account, a spouse’s 401k, a spouse’s Roth IRA, and so on. To understand how you have done or how you are allocated, you have to manually aggregate information from all of the statements. This generally requires maintaining a separate spreadsheet with lots of data entry each month – something that most investors do not take the time to do or simply do not know how to properly do.
They don’t really tell you how you’re allocated.
Consider the allocation summary below which comes directly from a brokerage statement.
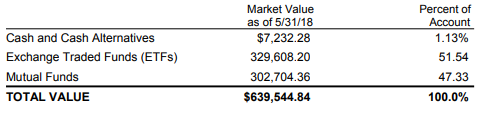 The takeaway from this summary is that 99% of the account is invested in something and 1% is held in cash. We have no idea how the 99% is invested other than in a mix of exchange traded funds and mutual funds which, for most purposes, are the same thing. There is no indication of how much is held in foreign stocks, short-term Treasuries, or REITs. More importantly, there is no way to tell how much is invested in stocks vs. bonds. What we learn from this summary is that roughly 99% is invested in something other than cash.
Here is the allocation summary from a different custodian which not only lacks usefulness but provides misleading information. 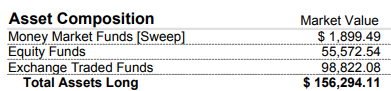
Despite the underlying account holding zero stocks or equity mutual funds, the statement arbitrarily lumps several alternative investments into the “Equity Funds” category for lack of a better place to put them. As a result, the composition summary is both uninformative and misleading. Whereas such simplified allocation summaries may have served a useful purpose in 1988 when nearly all investments were just stocks or bonds, they are a disservice in 2018 when investments are no longer just black and white.
They don’t tell you how much risk you’re taking.
Take your most recent account statement and see if you can determine whether your account is more or less aggressive than the S&P 500. Now try to determine some measure of historic volatility for your account or any type of downside risk that you are assuming. Good luck. Brokerage statements do not quantify risk. And if you don’t have any indication of how much risk you are taking, you won’t have any signal of how much you stand to lose in the next bear market.
The information is misleading and subject to manipulation.
On the “Investment Detail” summary from a brokerage statement below, there’s a column that shows the unrealized gain or loss for each position on the far right side.
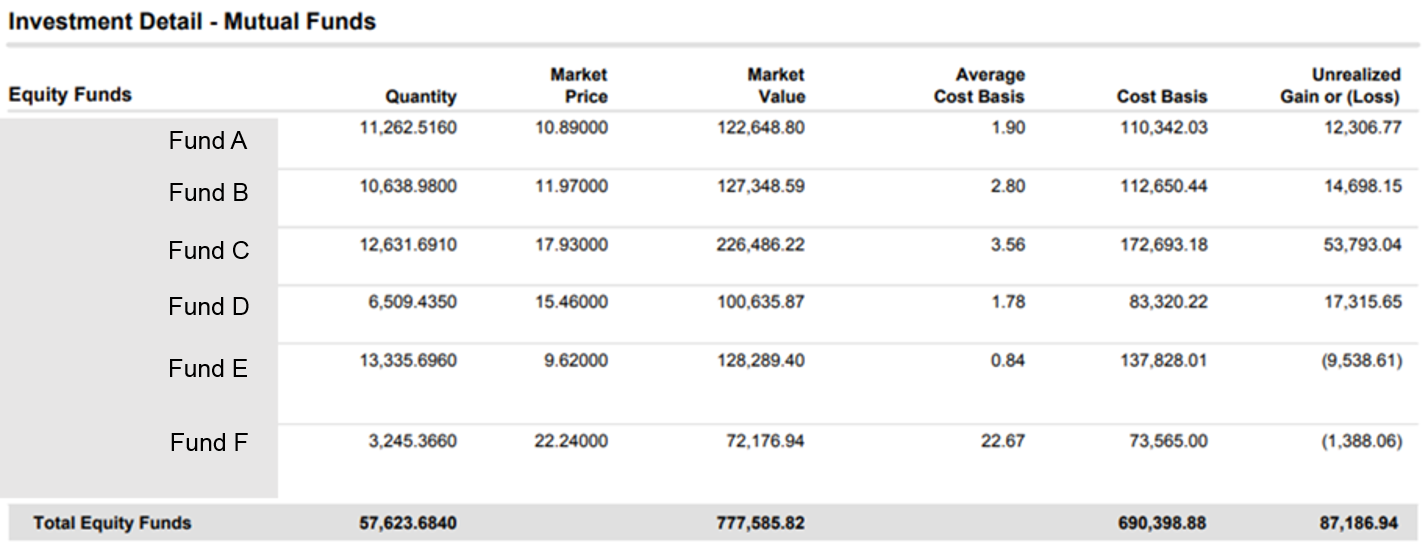
Many investors try to use this column to determine how their investments have performed. The misleading takeaway: Fund C is the best performing investment. But the reality is that this column only tells a fraction of the story and that this metric is useful for tax planning – not decoding investment performance.
In this account, the reality is that Fund F was the best performing fund…and by a wide margin. Most of the Fund F original position had been sold earlier in the year, recognizing a large gain (notably, this account is an IRA which makes the reporting of unrealized gain even more suspect). The remaining 3,245 shares – a more recent addition – were left showing an unrealized loss. To the average investor, it would seem as if Fund F has performed poorly when, in fact, it had performed exceptionally well.
It follows that a devious investment advisor can actually manipulate this column to fool clients. For example, if clients are using this column to gauge performance results, the advisor has an incentive to sell any positions that incur a loss and retain all positions with a meaningful gain so that all remaining investments show an unrealized gain. This does not change past performance results but it creates the faulty perception that the advisor has only picked “winners”.
There are two other notable problems with using this column to gauge performance. The first is that the metric entirely ignores holding period. Comparing the gain of a fund that has only been held for a few months with one that has been held for 15 years becomes a terribly misleading exercise.
Additionally, this column actually penalizes a fund that distributes income or dividends. Consider what happens if Fund D distributes a $20,000 dividend payment tomorrow. The market value concurrently drops by $20,000, the cost basis stays the same, and the unrealized gain/loss column goes from a gain of $17,316 to a loss of $2,684. Economically, nothing has changed but the column makes it appear that Fund D has performed poorly, not well.
Using the information on a statement may lead to bad investment decisions.
The following two examples come from the “Investment Detail” section of a brokerage statement – the top from a March 31, 2018 statement and the bottom from May 31, 2018. Even though the statements are just separated by two months, the “Estimated Yield” swings from 0.22% to 5.32%. This kind of dramatic swing is relatively common for this forward-looking metric. Another position on the same statement swings from a yield of 6.39% one month to 2.65% in the following month.


The explanation from the custodian is that these are estimates “provided by outside parties,” that the “accuracy of such information cannot be guaranteed” and that the figures “should not be relied upon for making investment decisions.”
Why do the estimates change so dramatically from month-to-month? There is no logical explanation. The much more logical question is why are these figures even reported if they’re not accurate and should not be relied upon for investment decisions. Because it is perfectly fathomable that at least one investor saw the estimated yield in March of 0.22% and decided to sell based on this metric while another investor saw the seemingly enticing estimated yield of 5.32% in May and decided to buy more.
Closing Comments
This is all not intended to suggest that all brokerage statements are worthless. It is to suggest, however, that most brokerage statements should not be used for anything more than a recap of transactions and a summary of current holdings. An investor who uses brokerage statements to make investment decisions or to draw conclusions about historic performance would be well-served to really understand the limitations of these statements for such purposes.
So what’s an investor to do? Here are some good starting points:
1) Never make any investment decisions based on numbers like yield, expected yield, unrealized gain, coupon rate, etc. from your brokerage statement. If you’re determining what to buy or sell and you’re using such figures from your brokerage statement, it’s time to get professional help.
2) Never rely on your brokerage statement to determine your asset allocation or to know the asset class of a specific investment. Just go with the assumption that the statement is wrong. If you want to determine your asset allocation on your own, you need to spend the time to research each underlying investment and compute the portfolio allocation in a spreadsheet. Otherwise, demand that your financial advisor provide your asset allocation in a separate report that properly categorizes each investment.
3) Do not rely on the brokerage statement to compute how you’ve done unless all you want to know is how much money you’ve made or lost over the past month. Demand that your financial advisor compute a “time weighted rate of return” for your entire portfolio over extended time periods like 5 years. Expect to get this metric from your financial advisor at least annually. If you’re trying to determine how you’ve done on your own, you will need to keep a spreadsheet with some formulas.
Have other thoughts, ideas, suggestions? Have comments or questions? Please leave them in the comments section below.


Leave A Comment